Battery Cycle “V-Shaped” Decay is a pivotal phenomenon in lithium-ion battery aging, revealing how performance degrades under varying conditions. This article analyzes aging in commercial 2170 cylindrical cells and lab-built pouch cells, evaluating how core aging mechanisms shift with charge-discharge rates, temperature, cell parameters, and State of Health (SOH). Additionally, it estimates the End of Life (EoL) standard (SOH = 80%) using Arrhenius plots.
As lithium-ion batteries age, their capacity fades, and internal impedance rises. The primary aging mechanisms include Solid-Electrolyte Interphase (SEI) growth, lithium plating on the anode (leading to Lithium Inventory Loss, LLI, which depletes active lithium for charge-discharge reactions), and secondary mechanisms like loss of active material (due to poor particle contact or crystal structure changes in electrodes).
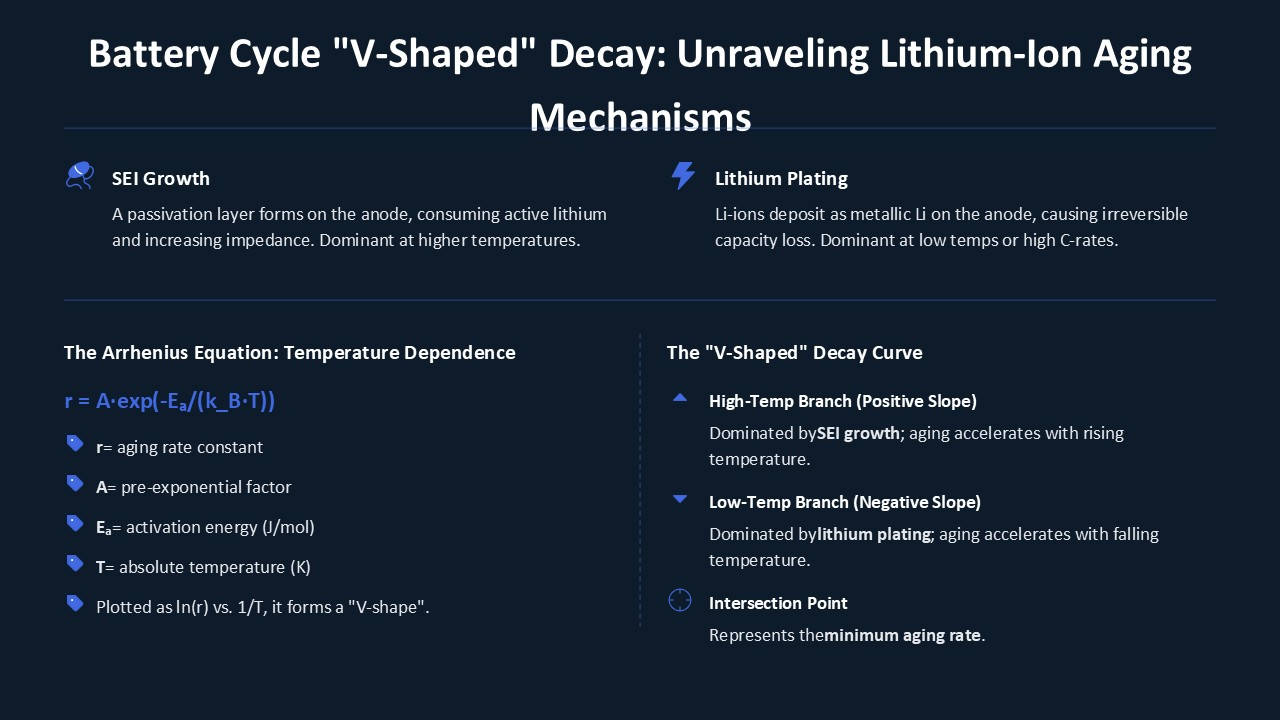
Arrhenius Equation and Aging Mechanisms
The Arrhenius plot is widely recognized in textbooks for describing the temperature dependence of chemical reactions. Researchers have extended this principle to battery aging, using it to model capacity fade, power loss, and impedance increase at temperatures ≥25℃. The Arrhenius equation (1) describes the rate constant as a function of temperature:
r = A·exp(-Eₐ/(k_B·T))
Where:
- A = pre-exponential factor
- Eₐ = activation energy
- k_B = Boltzmann constant
- T = absolute temperature (Kelvin)
Previous studies show that when extending the temperature range to include low temperatures (e.g., 0℃), Arrhenius plots exhibit two distinct slope branches. The high-temperature branch corresponds to SEI growth, while the low-temperature branch reflects lithium plating. Although aging behavior varies by cell chemistry, the overall trend of these two mechanisms persists across different battery types.
Identifying Three Decay Trends
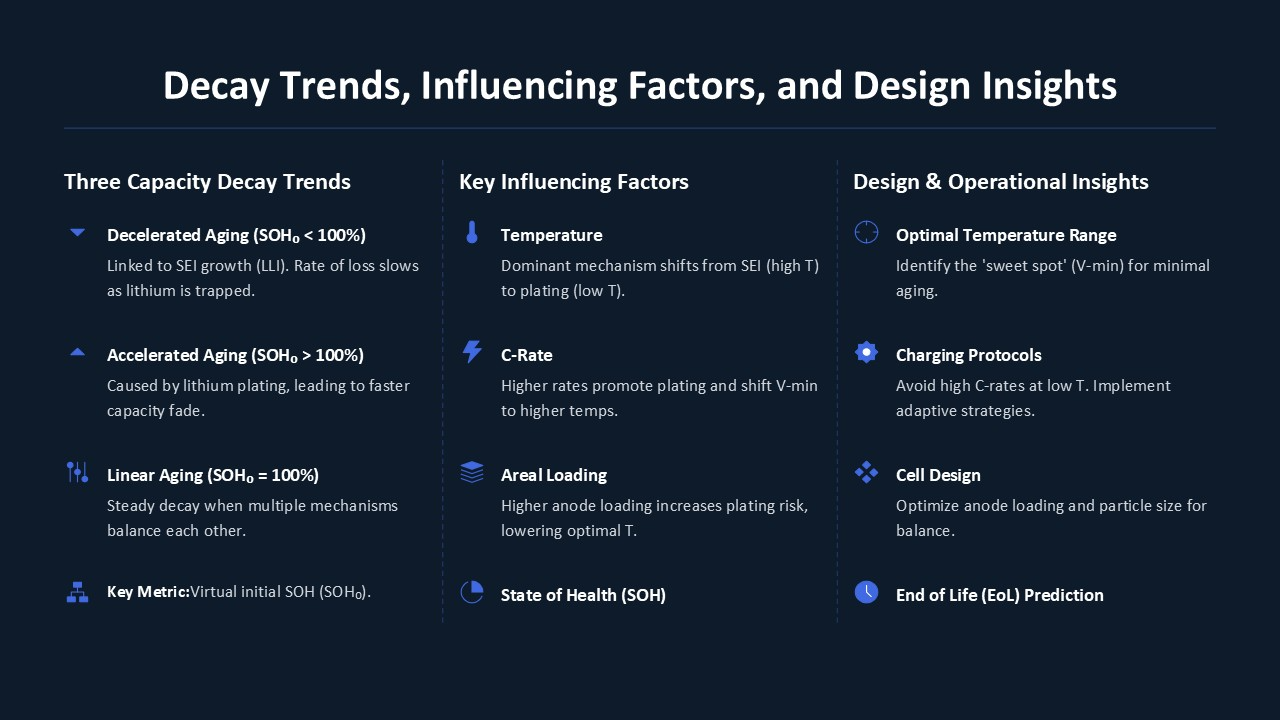
The shape of the capacity decay curve is dominated by the primary aging mechanism, typically falling into three categories: accelerated, decelerated, or linear.
● Decelerated aging:
Often linked to LLI. As lithium becomes trapped in the SEI, the electrode can no longer reach full intercalation, slowing capacity loss—this is the primary aging mechanism at higher temperatures.
● Accelerated aging:
Primarily caused by lithium plating during charging, which accelerates capacity fade.
● Linear aging:
A steady decay rate, with no significant acceleration or deceleration.
Linear fitting of specific SOH regions on the decay curve quantifies aging rates. Beyond slope analysis, the y-intercept of the linear fit (defined as the virtual initial SOH, SOH₀, for overall linear aging) provides a quantitative tool:
- SOH₀ > 100% = accelerated aging
- SOH₀ < 100% = decelerated aging
- SOH₀ = 100% = linear aging
Comparing SOH₀ values across different cell states and cycling conditions enables systematic evaluation of overall aging behavior.
Cycle Decay Across Rates and Temperatures
Identical batches of cells were cycled at 0.2C/0.4C/0.6C across various temperatures. Normalized discharge capacity (SOH) was plotted against cycle number, forming the dataset for further analysis.
Key observations from the curves (compared to 1C data in Figure 1f):
- As temperature increases from -10℃ to 60℃, the decay curve shifts from accelerated to decelerated.
- At constant temperature, higher C-rates transform the curve from decelerated to accelerated.
For detailed aging assessment, Arrhenius-type plots were constructed, plotting the natural logarithm of the aging rate (r, % per cycle, derived from the slope of capacity decay curves) against inverse temperature (1/(k_B·T)).
“V-Shaped” Decay and Influencing Factors
In Arrhenius plots, all tested cells (across SOH levels, cell types, and C-rates) show clear dual branches, forming a “V-shape” when fitting the data points. Importantly, the transition between SEI growth and lithium plating is gradual, not abrupt—both mechanisms operate simultaneously (to varying degrees), even if one dominates. A limitation of Arrhenius plots is that they highlight the primary mechanism, overshadowing secondary, parallel aging processes.
The intersection of the two branches in the “V-shape” represents the minimum aging rate and, thus, the longest expected cycle life. This intersection temperature is where the dominant aging mechanism shifts.
1. Impact of Areal Loading
Lab-built pouch cells exhibit a much lower optimal intersection temperature than commercial cylindrical cells at similar C-rates. For example, at 0.2C and 100% SOH:
○ Pouch cells (anode areal loading:
2.50 mAh/cm²) age slowest at 6℃.
○ Commercial cells (anode areal loading:
5.38 mAh/cm²) have an intersection temperature of 16℃.
Higher areal loading, combined with larger anode particles in commercial cells, increases susceptibility to lithium plating.
2. Impact of C-Rate
For nearly all SOH levels, increasing the C-rate shifts the intersection of the two aging mechanisms to higher temperatures. This is logical: lithium plating occurs when lithium diffusion in the graphite anode is too slow to keep up with the charging rate. Surface and near-surface regions of graphite particles become fully lithiated, while inner regions remain under-lithiated. Continued charging forces lithium to plate on the anode surface instead of intercalating into the electrode.
3. Impact of SOH
Consistent with the decelerated shape of most capacity decay curves, Arrhenius plots show that aging rates decrease as cycle number increases. A key trend emerges:
- At low temperatures, the slope of the Arrhenius line remains relatively consistent across different SOH levels and C-rates.
- At high temperatures (25–55℃), the slope of the Arrhenius line gradually decreases (approaching zero) as SOH declines.
This is because SEI growth is a self-passivating process—over time, the SEI layer stabilizes, reducing the temperature dependence of aging. In contrast, lithium plating is a self-amplifying mechanism: plated lithium thickness increases almost linearly with cycles, accelerating decay.